
Sections contributed too: Analyst Insights | Market Trends | Perspectives
Project Brief
Every quarter at PitchBook, we build high Fidel infographic & illustrations for summaries on the PE & VC industry. We produce this content in our quarterly PlayBook magazine. Analysts Insights is written by PitchBook’s data analysts about Private Equity, Venture Capital, Funds Strategy, and other private business trends. Market Trends is a summary of the private markets key numbers. Perspectives is written by PitchBook’s news & analysis team. I design the data graphics for the writers & build the magazine layout for those specific sections.

Proposal: Every quarter, I work with the data analysts & news and analysis writers to produce graphics for their data content
Role: UX UI Designer & Researcher, Production & Visual Artist
Softwares & Tools: Indesign & Illustrator
Audience: The PE & VC industry, audience’s age are typically 30+, 70% are mainly men readers, 30% are women readers
User ability interviews

User 1 need:
An app that gives data on where to catch the best swell. An application that provides tools to advance the surf experience.
Behavior: He surfs 1-2x a week due to work. He is fitness oriented and cares about the data being synced with his apple health.

User 2 need: An app that will track time & duration of surfed waves, cataloging their experience in the app database. Data that tracks ocean movements and currents to better predict wave conditions.
Behavior: A competitor surfer. He is sponsored mainly by Red Bull, but loves using products with other surf brands such as O’Neill or Quicksilver.

User 3 need: An app that will save time for researching better swells, finding water conditions and helps track the surf experience for data.
Behavior: Already pretty knowledgeable of oceanography & water conditions. She surfs at least once a day in between jobs. She is very into fitness, and uses apps such as Nike and Strava.
Mood Board

Sketches

Wireframes

Color Palette Stage 1

Initially, the first prototype was built with this color palette. I received feedback from my peers during a user-testing session, that these colors blended into the ocean, and it would be preferred to have colors that would help the app pop out more while using it when surfing.
Prototype Stage 1
Color Palette Stage 2

The second color palette created an eccentric vibe that was friendly for the user. I received feedback from my peers during the second user-testing session, that these colors were successful because the application popped out while being used in the water. The goal was to create a brand that would evoke calm emotions while surfing and create a succeeding experience for the user.
Typography
Prototype Stage 2
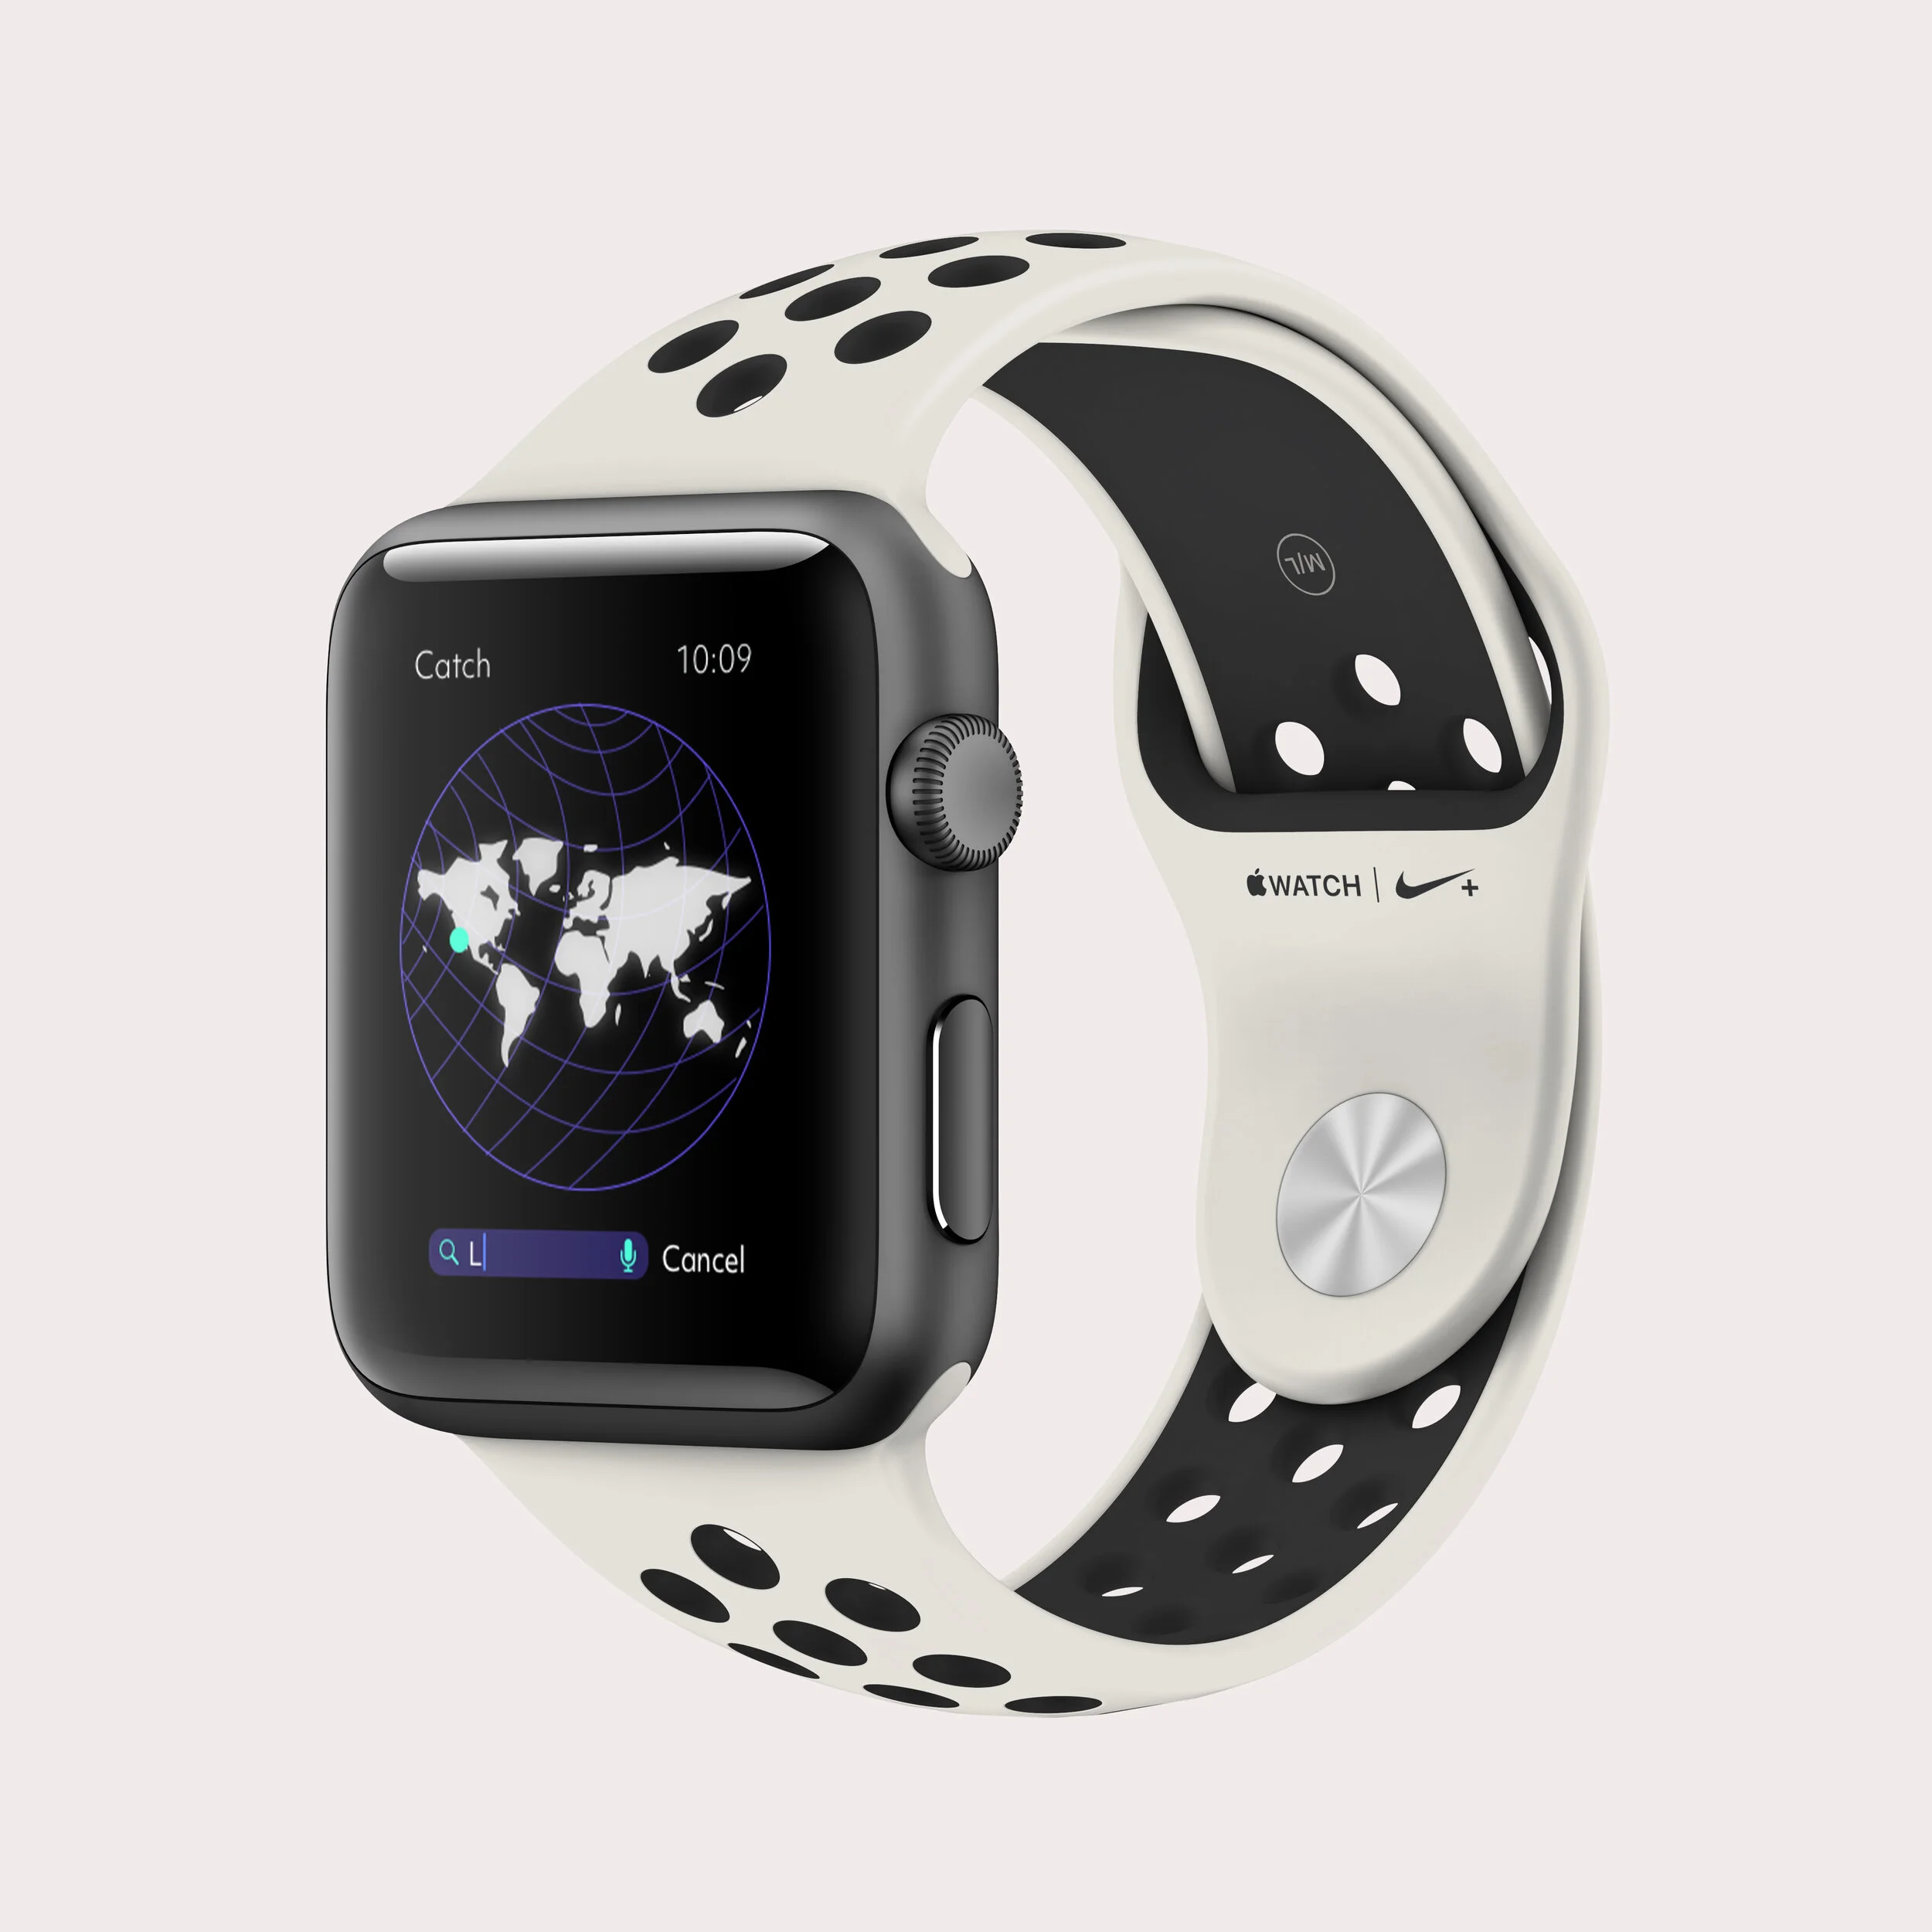
Final Product
Features
Settings allow for the app to be viewed in night function for evening surf time
• Login with user functions to keep track of your data & connect with the surf community
•Connect the GPS location for surf data accuracy on conditions•
Find out conditions on weather, wave height, wind, temperature and swell duration
Find chat rooms with in the surf community for specific beach updates
Connect the health function to your apple health to stay hydrated & keep track of time
AR function where it scans water for safety during surf session

Concluding thoughts: Overall, I received solid feedback on the clean, minimalistic design. The colors were a success and the transitions were user friendly. The features of the application met the user’s needs.
Next steps:
It would be great to have data that further tracks, the surfs movements and stance on the board; a type of scanner that can analyze the surfer’s body movements.